 |
||||||||
|
Drilling for Data
As stakeholders continue to seek the best figures on Pennsylvania’s Marcellus Shale activity, Carnegie Museum of Natural History offers what’s long been desired: accurate and user-friendly baseline information. With an estimated $200 million in Marcellus Shale impact fees up for grabs in Pennsylvania this September, data on natural gas drilling across the state is under the microscope now more than ever. A misidentified well or two could cause a municipality to lose out on tens of thousands of dollars, or more. Yet several months before communities can expect to start cashing in, agreeing on simply how many Marcellus Shale wells exist in the state remained just out of reach. It’s a frustration all too familiar for local governments, urban planners, and environmental and economic researchers long on the hunt for reliable public information about well activity, including researchers at Carnegie Museum of Natural History’s Center for Biodiversity and Ecosystems who have been monitoring the health of regional streams. The problem isn’t a lack of information, but making sense of what’s available. “That’s why nobody’s numbers match exactly,” explains center director John Wenzel. The state’s Department of Environmental Protection (DEP) regularly makes available for public consumption six independent datasets of information about the wells: permits issued, wells drilled, reports on natural gas production, waste production, and violations, as well as the Public Utility Commission’s (PUC) list of wells, which ultimately will be used to determine impact fees. But this raw data isn’t cross-checked for errors nor is it integrated, making it cumbersome and time-consuming to compile a single list. Until now. Using the resources of its Geographic Information Systems (GIS)-lab based at Powdermill Nature Reserve, this past May the museum released a unified database—pulling from those same DEP datasets—that provides a one-stop shop for information about Marcellus-related natural gas development statewide. Numbers, and more numbersAccording to the museum’s findings, through April 30 of this year, the state permitted 9,848 Marcellus Shale wells, of which 6,391 are drilled and/or are currently producing. The data also pointed to 2,457 wells with active permits that could eventually be drilled and another 1,000 wells that either have expired permits, are abandoned, plugged, declared inactive, shut-in, or their status is unknown. The information is easily searchable by community, says James Whitacre, the museum’s GIS manager who created the new tool. Just as important, it pinpoints discrepancies across the datasets, highlighting gas operators with the highest percentage of record-keeping errors, as well as a lack of transparency in how the DEP formed the Public Utility Commission list, Whitacre says. In May, he compared the DEP’s five published datasets with its still-a-work-in-progress PUC list, finding 1,313 additional wells that, according to the DEP’s own records, should appear on the PUC list. “At the end of the day, the lack of attention to detail was based on, call it lack of consequences, or simply the need for this level of accuracy wasn’t quite as high,” says Scott Perry, the deputy secretary of the DEP’s Office of Oil and Gas Management, about the record keeping for Marcellus wells prior to Act 13 legislation, which now requires operators to pay impact fees on drilled wells. The museum’s unified list was welcome news, not just for those being compensated for the price of drilling, but for researchers, industry, public officials, the media, and the public. “The museum has done a great service to those of us in the conservation community because, in the past, a bunch of different people would make their own compilations of the DEP data, duplicating efforts,” says Tamara Gagnolet, a GIS analyst and conservation data manager for the Nature Conservancy. The Conservancy regularly relies on this information to inform projects such as forecasting where energy development is most likely to pose risks to Pennsylvania’s most important natural areas. “We’re thrilled because James has done a much more thorough job than most of us would ever have the time to do,” she adds. “And we know and understand his methods, so we know the information is reliable.” According to Wenzel, more than 60 other individuals have requested access to the database, and information culled from it is already in use as part of water-monitoring efforts at Powdermill and in a variety of Marcellus-related research by the Western Pennsylvania Conservancy, the Nature Conservancy, Indiana University of Pennsylvania, Duke University, and Pennsylvania State University. Later this year, the museum hopes to translate the information into easy-to-understand maps made available to the public on its website. Tracing the life of a wellThe database was born last July as part of a larger initiative to position the museum’s center as the authority on Appalachian ecosystems. Funded by the Richard King Mellon Foundation, a top goal was to harness the power of the center’s GIS-lab by mapping Powdermill and the landscape around it. One day, GIS intern Josh Krug, a regional planning major at Indiana University of Pennsylvania, asked Whitacre a simple question: When mapping sociodemographic impacts of the Marcellus Shale industry, such as population change, change in land value over time, and median income, should he use the DEP’s list of permitted wells or its spud reports, which list the wells that have been drilled? “The answer seemed obvious,” recalls Whitacre. “Permits are the record of where wells will be built, but the spud reports tell us what’s there and being drilled.” The pair quickly recognized, though, that not all researchers used this same baseline. “So we started digging,” to find out why, Whitacre says. What they discovered was a well of DEP data peppered with inconsistencies that took significant time and effort to sanitize, a task Whitacre worked on, off and on, for nearly a year. He sought the input of researchers long embedded in the data, and then, last fall, shared his work in progress at a geography conference. In May, he debuted it publicly and made a brief presentation at the Multi-state Marcellus Shale Research Conference attended by many of the major academic research institutions and conservation communities in Pennsylvania, Ohio, New York, and West Virginia. “We knew in advance of the conference that every researcher there was going to say what we’ve all been saying: that we need a single list; why isn’t there a single list?,” says Wenzel. “Finally we were able to go to them and say, ‘Here it is!’” The museum’s efforts serve another invaluable function, notes Ephraim Zimmerman, an ecologist with the Western Pennsylvania Conservancy. “What the museum is doing provides an independent assessment of the numbers provided by DEP, which I think everyone can agree is valuable,” says Zimmerman. Another surefire sign of progress: The DEP is listening, and has taken action. When Whitacre first started reconciling information from the six datasets last fall, he found a 9.5 percent error rate between the lists, a figure that dropped to 6.5 percent this past spring following improvements DEP made to its own internal processes. “We want to give the DEP credit,” says Whitacre, “the errors are dwindling.” But the DEP isn’t necessarily the biggest culprit in less-than-stellar record keeping. Many of the inconsistencies across datasets—whether a well is uniformly listed as Marcellus or not, or a producing well has no record of a permit or a spud report—are not random, pointing to a pattern of reporting errors by specific oil and gas operators. “The inference is always that the DEP is somehow to blame,” says Wenzel. “Our database demonstrates that they’re not. Some operators are sloppy with paperwork, with one-third of their records containing errors.” One company among those with more than 50 Marcellus wells in the state that had no errors: WPX Energy (a spinoff of Williams). No one is saying this chronicling translates to anything dishonest or illegal, says Wenzel. But record-keeping errors do translate into inaccurate DEP data—and, as any good scientist will tell you, research is only as good as the data behind it. Money talks“We’re working now on some permanent solutions to these problems,” the DEP’s Perry notes, “which in my opinion is fundamentally about enhancing the way we collect and store information.” The DEP is currently implementing long-overdue improvements to its outdated information collection and storage systems, and moving towards an all-electronic reporting system designed to eliminate human error. The new gas drilling impact fee is forcing system-wide improvements at a rapid pace, says Perry. “The operators have a much more vested interest in the accuracy of their numbers, so it will help out tremendously,” he adds. “And obviously we’re spending a lot more time reviewing the information we get.” What about the 1,000-plus discrepancy that Powdermill found between the DEP’s data and its PUC list? “We were able to use Powdermill’s reports to go back in and do another round of reviews of our wells,” Perry notes. “We looked at what wells do they have on their list that we don’t, and can we explain it? It was helpful to check against.” The result? The DEP went back and corrected files, Perry says. When they tallied the list again, they arrived at almost the same number of wells as appeared on their original PUC list, he says, but some wells were added and some were subtracted. The museum plans to re-run its reports when the latest well-production reports are available in August, after this issue of CARNEGIE magazine goes to press. Once the DEP’s list is finalized at the end of summer, the PUC will release a formula clarifying the distribution of impact fees. Sixty percent will go to local governments. Impact fees will be collected on September 1. The first disbursements are expected in December. “The first response from the DEP was that they want to talk to us about our differences in numbers, and they have,” says Wenzel. “We embrace that. We have to get to the point where we have one set of numbers we all refer to. If somebody wants to add something to our database, to our way of thinking, we don’t see that as a black eye. We see that as how science is done.” The Skinny on Shale
Marcellus Shale is 390 million years old and was formed from algae, mud, and sediment in an ancient sea. Marcellus is the largest natural gas field in the United States. It covers about 104,000 square miles of sub-surface beneath Kentucky, Maryland, New York, Ohio, Pennsylvania, Tennessee, Virginia, and West Virginia. Natural gas is a nontoxic, gaseous mixture of hydrocarbons—predominantly methane. It accounts for about a quarter of the energy used in the United States. "Wet" gas includes octane, butane, and propane. These liquid hydrocarbon compounds form from the increase in temperature, longer periods of geologic time, and deeper burial over millions of years, compared to those formations that generate “dry” gas. Low-yield natural gas wells have been drilled in Pennsylvania for more than 60 years. The technique of horizontal drilling and hydraulic fracturing of Marcellus Shale commenced in Pennsylvania in 2006, with 2008 considered its “break out” year. Hydraulic fracturing (or “fracking”) involves pumping millions of gallons of water, sand, and chemical additives into the rock under very high pressures to fracture the rock to release the gas. The fractures are kept open by sand, while the chemicals are added to help cleanse the well bore so the gas flows to the surface efficiently. Horizontal drilling is an engineering technique that sends a drill vertically underground up to 10,000 feet, then turns it at a 90-degree angle and drills horizontally several thousand more feet. On average, horizontal wells produce three to five times more natural gas than vertical ones. Each gas well that is hydraulically fractured requires 3 to 5 million gallons of water. Roughly 65 percent of the water used comes from rivers, creeks, and lakes. The other 35 percent is purchased from municipalities by drilling companies. Pennsylvania uses about 8-10 million gallons of water per day for Marcellus Shale drilling, which represents approximately .1 percent of the 9.5 billion gallons of water the state uses daily. Increasingly, drilling companies are using recycled water from previous fracking as they drill Marcellus wells. Mapping Marcellus
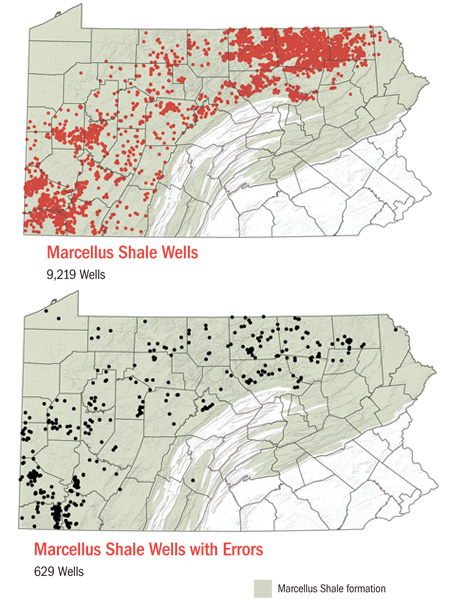
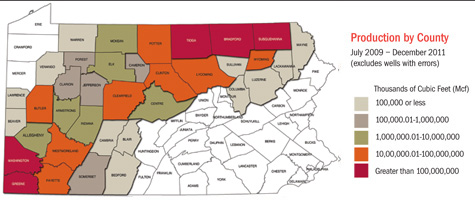
The top two maps illustrate the museum’s analysis of the six datasets made public by the DEP through April 30. A 9.5 percent record-keeping error rate last fall dropped to 6.5 percent this spring.
Energy Show and Tell
On a recent weekday afternoon, museum educator Pat McShea rolls a cart into Carnegie Museum of Natural History’s Benedum Hall of Geology, and as visitors exit on their way to the dinosaurs, he asks if they’d be interested in seeing a piece of Marcellus Shale. “Have you heard about it in the news?” he asks, pointing to a small banner filled with basic facts and an image of a Marcellus Shale well being drilled. “It’s about a mile below us.”
Upon sliding their fingers across the black, 8-inch-thick chunk of shale, visitors pepper McShea with a variety of questions, some hesitantly, about the much-talked-about Marcellus formation—from how long it’s been drilled in the state (about seven years) to how many chemicals are part of the fracking process they’ve heard so much about (about 50). At McShea’s prompting, visitors place a drop of water first on the Marcellus Shale and then on an accompanying piece of caramel-colored Oriskany sandstone, once a prolific source of natural gas, using the eraser on a pencil. “So do you notice how the water gets absorbed rather quickly into the sandstone, but it takes longer on the Marcellus Shale?” he asks. “That’s because it’s less porous. Natural gas is trapped within those tiny spaces in the rock.” McShea shares nuggets of basic information, including that the formation was named after the village of Marcellus in New York where it appears very close to the surface, and that it lies beneath about 95,000 square miles of Pennsylvania, New York, Ohio, and West Virginia. To get to it, he explains, first they drill underground vertically up to 10,000 feet, then horizontally up to 10,000 feet, breaking open thin layers and pores in the rock, capturing the gas. “Do you understand why we care about it?” Ann Moats, a mother of three from Economy Borough, asks daughters, Cassie, 11, and Vanessa, 8. “It stores energy, like what heats our homes, which makes it incredibly valuable.” McShea says he’s had all kinds of visitors weigh in on the process, including rig operators. On this particular day a physical therapist from Potter County, located midway between the eastern and western boundaries of Pennsylvania along the New York border, noted that drilling gave a bump to his business due to the physical evaluations they perform on local gas workers. For most, it’s an unexpected chance to lay eyes on the formation for the first time, making it a little easier to grasp the basic science and controversy around it. “I think it’s a good role for the museum to play, to help visitors learn in a trusted environment about what it looks like, where it is, and how we get to it,” says Moats, a longtime member. “It’s a brand new topic in our lifetime. It’s politically charged, but the museum can help provide an unbiased look, and that’s incredibly valuable.”
|
||||||||
Ripped from the Headlines · The Advent of Modern Global · Perspective: Making Museums Matter · Director's Note · NewsWorthy · Face Time: Robert Marshall · Science & Nature: Womens Work · Artistic License: Personal Pop · First Person: A Feathered Face of Forest Fragmentation · The Big Picture
| Copyright © 2017 CARNEGIE Magazine. All rights reserved. |